SHIB Price Prediction: Bullish Trend with Short-Term Risks

#SHIB
- SHIB is trading above its 20-day MA, signaling bullish momentum.
- MACD shows a positive crossover, supporting upward price movement.
- Bollinger Bands indicate volatility, with potential overbought conditions.
SHIB Price Prediction
SHIB Technical Analysis: Bullish Momentum with Caution
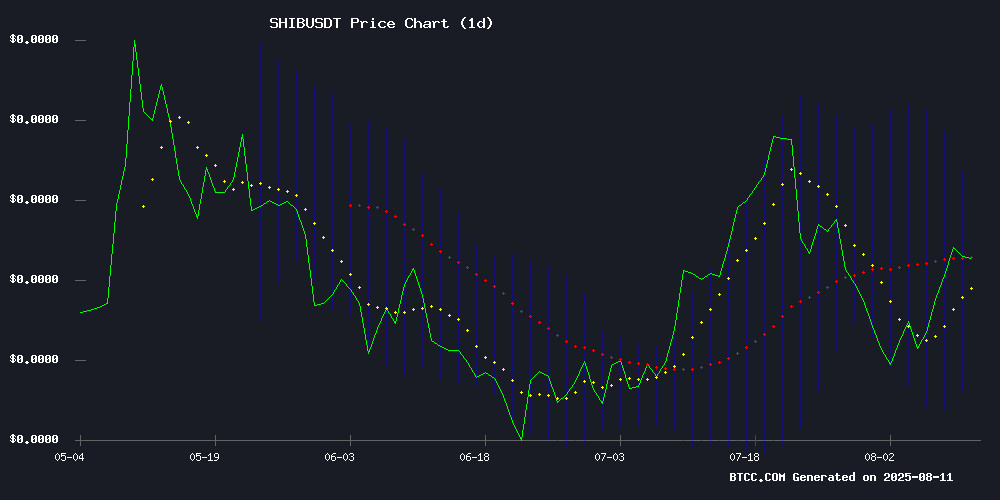
According to BTCC financial analyst Ava, SHIB is currently trading at 0.00001352 USDT, above its 20-day moving average of 0.00001307, indicating a bullish trend. The MACD shows a positive crossover with values at 0.00000091 (MACD line), 0.00000088 (signal line), and 0.00000003 (histogram), suggesting upward momentum. Bollinger Bands indicate volatility with the price near the upper band (0.00001453), which could signal overbought conditions. Traders should watch for potential pullbacks to the middle band (0.00001307) or lower band (0.00001162) for entry points.
SHIB Market Sentiment: Mixed Signals Amid AI Predictions
BTCC financial analyst Ava notes that SHIB faces divergent signals as AI predictions suggest a potential 16% drop, weighing on bullish momentum. However, signs of accumulation and reduced reserves could fuel a future rally. Market sentiment remains cautious, with technical indicators still favoring a bullish outlook despite negative AI forecasts.
Factors Influencing SHIB’s Price
SHIB Price Faces Potential 16% Drop as AI Prediction Weighs on Bullish Momentum
Shiba Inu (SHIB) trades with muted bullish signals as Google's Gemini AI forecasts a 16.388% decline to $0.00001 by August 31st. The prediction, based on weak technical indicators and reduced token burn activity, has injected bearish sentiment into the market.
Contrasting this outlook, SHIB exchange reserves have plummeted to $1.05 billion—their lowest level in 2025—down from $4.77 billion in late 2024. This sharp reduction suggests accumulation by long-term holders moving tokens to private wallets, typically a bullish signal.
The memecoin's 5th anniversary on August 4th failed to catalyze significant momentum. Traders now weigh AI-driven pessimism against on-chain evidence of supply tightening, creating a bifurcated market narrative.
Shiba Inu Faces Divergent Signals as AI Predicts Decline Amid Accumulation Signs
Shiba Inu (SHIB) hovers at $0.00001196, caught between bearish AI forecasts and bullish on-chain activity. Google Gemini projects a 16.4% drop by month-end, citing weak technicals and dwindling token burns, yet exchange reserves have plunged to yearly lows—a classic accumulation signal.
The meme coin's RSI at 54.18 reflects market indecision, while the $0.000010 support level held firm on August 5. Analysts remain split: some see extended weakness, others spy contrarian opportunity in the divergence between AI pessimism and holder behavior.
Could Reduced Reserves Fuel the Next Shiba Inu Price Rally?
Shiba Inu's price action is drawing renewed interest as gaming integrations and token burns align with its fifth-year push toward decentralization. The meme coin trades at $0.00001393, up 6%, as shrinking exchange reserves and community-driven utility spark breakout speculation.
Ecosystem lead Lucie emphasizes SHIB's organic growth, dismissing exaggerated claims of external development. "SHIB is a people’s coin with its own USP," she notes, urging holders to maintain momentum. Gaming initiatives now serve dual purposes—rewarding players with tokens while Shibarium transactions systematically reduce supply.
Is SHIB a good investment?
According to BTCC financial analyst Ava, SHIB presents a mixed investment opportunity. Technical indicators suggest bullish momentum, but AI predictions and market sentiment indicate short-term risks. Below is a summary of key data:
| Metric | Value |
|---|---|
| Current Price | 0.00001352 USDT |
| 20-day MA | 0.00001307 USDT |
| MACD (12,26,9) | 0.00000091 | 0.00000088 | 0.00000003 |
| Bollinger Bands | Upper: 0.00001453 | Middle: 0.00001307 | Lower: 0.00001162 |
Investors should weigh the bullish technicals against potential downside risks from AI predictions and market sentiment.
